
Workflow guides
FAA AI and SMART: What Is Confirmed and How to Explain It
FAA’s SMART system supports scheduling recommendations reviewed by people. Its rollout and a later communications incident are separate facts; a timeline alone does not establish causation.
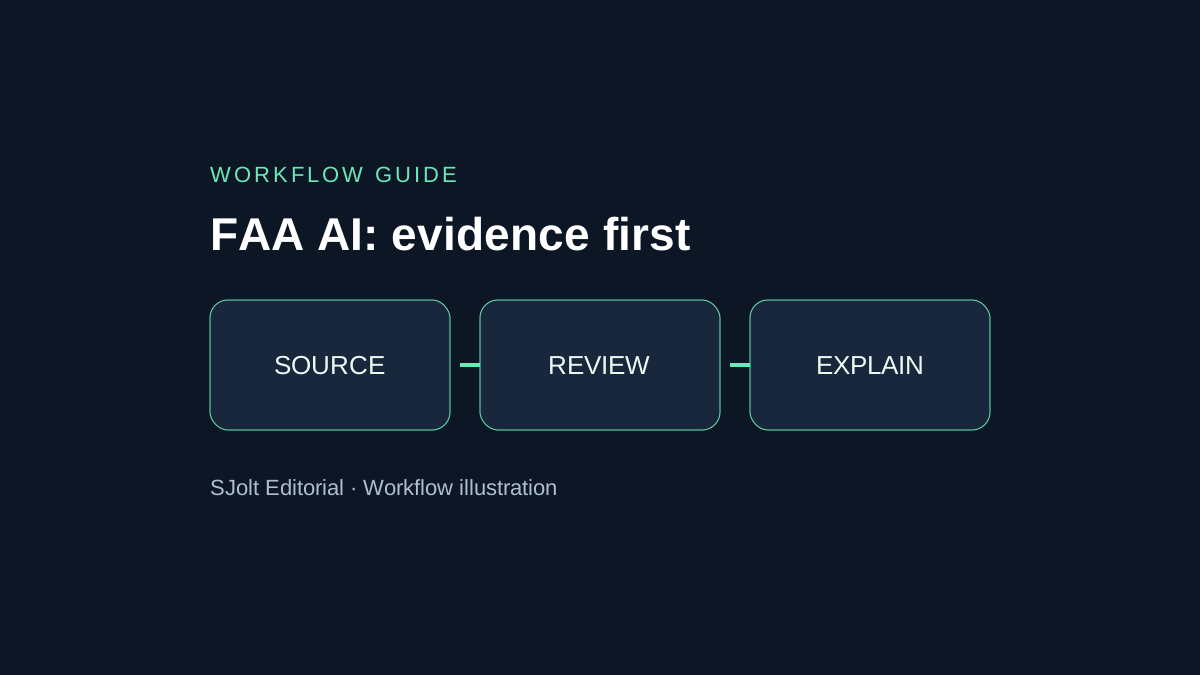
FAA AI searches currently bring together two different questions: what the SMART system does, and whether it caused the November 13 communications incident. Official sources confirm the deployment and the incident separately. The statements reviewed here do not establish that SMART caused the disruption.
This guide uses FAA and Department of Transportation material checked on November 14, 2026, Beijing time. It explains the documented review chain and provides a practical method for making an educational explainer. It is not a flight-status service or operational aviation guidance.
Keep the deployment and incident records separate
On November 10, the FAA announced SMART’s expansion to airspace covered by all 22 centers after the initial National Capital Region rollout. It also reported early efficiency gains. Those agency-reported observations are not a nationwide guarantee or an independent evaluation.
On November 13, a separate preliminary FAA statement reported a nationwide ground stop following communications problems at multiple control centers, with technicians investigating. It did not attribute the incident to SMART or Microsoft. Timing alone cannot establish the cause.
For a dated explainer, save the exact source URL, publication date, retrieval time and a short paraphrase of the claim. Keep “confirmed event,” “reported outcome” and “unresolved cause” in different fields. If the agency later publishes findings, replace the unresolved field with the new evidence and retain the earlier version in your editorial record.
What the human review chain looks like
SMART stands for Strategic Management of Airspace, Routes and Trajectories. DOT’s September 21 launch describes an AI-supported planning tool using information such as weather, routes, traffic and staffing. It explicitly says the tool cannot replace controllers or take control of an aircraft, and that staff review its recommendations.
FAA specialists validate the data and send scheduling recommendations through the System Command Center to local leadership. Describe that review chain explicitly; an arrow straight from “AI” to “aircraft” would misrepresent it.
| Layer in an educational diagram | What to show | What to avoid implying |
|---|---|---|
| Inputs | Weather, demand and other data categories | A complete or live list of operational feeds. |
| Recommendation | A proposed scheduling change | A command sent directly to an aircraft. |
| Review | People assessing the proposal | Automatic acceptance of every output. |
| Decision | A recorded acceptance or rejection | That an illustrative diagram is a real control interface. |
These diagram choices are an editorial interpretation of the described process. Use arrows to explain responsibility, not to invent technical interfaces. If a source does not specify the model architecture, hosting provider or API, leave those details out instead of filling the blank with a familiar brand.
Ask questions that the available numbers can answer
An efficiency figure needs a denominator and a comparison condition. Before turning a reported saving into a chart, identify the observed period, which flights were included, how the baseline was calculated and whether other changes occurred. If the source does not supply those details, say the number is reported by the agency and avoid extrapolating it nationwide.
Use the same discipline for failure analysis. Deployment dates establish sequence; causal attribution requires evidence connecting a mechanism to the observed failure. A screenshot, a social post or a matching keyword does not supply that mechanism. Keep open questions visible rather than hiding them behind a confident headline.
Evidence card for an explainer
Claim: one narrowly stated fact
Source: original publisher and URL
Published / checked: dates with timezone
Evidence type: agency statement / reported metric / analysis
Scope: system, geography and time period
Unknown: cause, denominator or interface not supplied
Allowed caption: wording no stronger than the evidence
Have a second reader compare each caption with its evidence card. They should be able to identify which sentence supports the claim without relying on the illustration. If the graphic is removed, the explanation should still be accurate; if the caption is removed, the image should not imply a stronger operational claim.
Build an educational visual with an explicit boundary
For an article or classroom presentation, start with a simple three-panel layout: data categories, human review and a scheduling recommendation. Add the labels in a layout editor so spelling and arrows are controlled. Avoid runway diagrams, real flight numbers or apparent live traffic positions that could make a conceptual graphic look like an operational display.
SJolt’s Nano Banana 2 text-to-image route can create an illustrative background for this communication task. It is an image-generation workflow, not a connection to FAA systems. SJolt does not list SMART as a model in the reviewed catalog, and this article makes no claim of FAA approval or certification.
Concept illustration for an educational article about human review of scheduling recommendations. Three separated panels: abstract data cards, a person reviewing a document, and a proposed calendar change. Calm navy and teal palette. Leave blank areas for labels added later. No agency seals, flight numbers, airport maps, radar screens, logos or text.Keep the source-grounded explanation outside the image prompt. The image model is being asked for composition, not to determine what caused an outage. Review the asset for invented labels and misleading symbols, then add a visible caption identifying it as a conceptual illustration. No image was generated or benchmarked for this guide.
A final editorial check before sharing
Check the exported graphic at phone size. The human reviewer should remain visually distinct from the proposed action, and the arrows should not bypass that reviewer. Confirm that the caption includes the date of the explanation and links to both the deployment statement and the incident statement.
Keep the project editable so an official finding can be incorporated without rebuilding the entire illustration. When updating, distinguish a newly confirmed fact from a correction to your own earlier wording. This produces a durable explainer that can absorb better evidence while preserving an honest account of what was known at publication.
Sources & further reading
Take the next idea into production.
Explore the models, test a workflow in the playground, and use the same request in your application.